
Monday, November 19, 2012
Saving or drowning?
I'm tiring of politics for the moment (I know--you too), so I'll endeavor to find other interesting things to talk about.... like saving money. Friends occasionally ask how much they should be saving for retirement, so I thought this might be of general interest. The chart below shows the percentage of one's income they should be saving depending on how long of retirement they're planning on (and how far away it is). To keep it simple, focus on the bottom half (which means you'll be living on 70% of your pre-retirement income). As highlighted, those of us ~30 years from retirement should be trying to sock away ~20% of our pre-tax income each year. Tough for sure, but it sure beats working when you're seventy. PS, notice what a difference waiting ten years makes.

The objective case for unions
There's been a lot of talk about unions lately because of the demise of Hostess, the Twinkie maker. Sure, the company probably went out of business because it couldn't pay the salaries demanded by the union. That's often the end of the analysis if one thinks of the Hostess union in isolation. BUT, if (like in the 1960s) a significant part of the labor force is part of a union, then the resultant effect is that median wages go up across the economy (compared to years with low unionization rates). Where does this money come from to pay for higher wages? Well, it basically means that the company's bottom line takes a hit and there's less money left over for the stockholders. Now, let me ask you, is your income primarily derived from holding stocks or from working? If it's the latter than you'd probably be better off with stronger unions.
Two academics (Western at Harvard and Rosenfeld at the University of Washington) released a paper last year in American Sociological Review which concluded that the decline of unions over the last ~40 years is responsible for up to one third of the concurrent growth in income inequality. See here and here (possibly gated). Here are some more details from Kevin Drum:
Postscript: one may worry about corporate profits (and company sustainability) amidst higher wages, but, despite the recession, over the last couple of years corporate profits have actually been at an all-time high.
Two academics (Western at Harvard and Rosenfeld at the University of Washington) released a paper last year in American Sociological Review which concluded that the decline of unions over the last ~40 years is responsible for up to one third of the concurrent growth in income inequality. See here and here (possibly gated). Here are some more details from Kevin Drum:
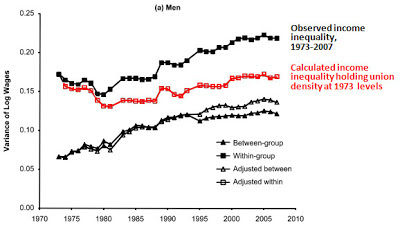
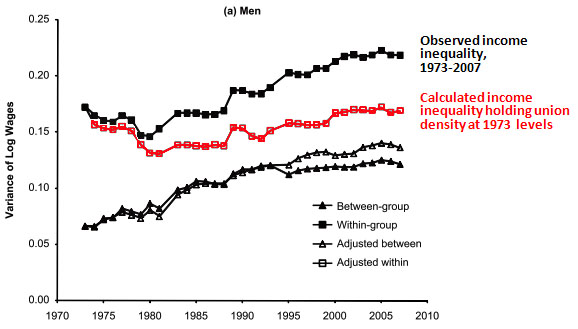
The authors use a model that accounts for both individual membership in unions as well as overall unionization rates in specific industries and regions. It also controls for education, age, race, ethnicity, and gender, which allows them to estimate the effect of unionization both between groups (e.g., the evolution of income inequality between high school dropouts and high school grads) and within groups (e.g., the evolution of income inequality within the entire subset of high school grads).
Once their model was in place, Western and Rosenfeld could manipulate their variables to estimate what income inequality would look like if union density had remained at its 1973 level. So what did they find? Answer: Among men, if you account only for the effect of individual membership in unions, it would be about a fifth lower, which agrees pretty well with previous estimates. But if you also account for the effect of unions on surrounding nonunion employers (who often raised wages to compete with union employers and to avert the threat of unionization in their own workplace), the effect is larger: Unionization at 1973 levels would decrease income inequality by a full third. You can see this in the chart below. For intragroup differences (which account for nearly the entire effect of unionization) the top line shows the actual rise of income inequality since 1973, while the red line is a prediction of what it would look like if union density were still at 1973 levels:
Of course, my title might be a bit misleading. One can only say there's an objective case to be made for unions if one wants to reduce income inequality. If you prefer more of a Gilded Age, well, then the unions' continued decline will do the trick.
Postscript: one may worry about corporate profits (and company sustainability) amidst higher wages, but, despite the recession, over the last couple of years corporate profits have actually been at an all-time high.
Friday, November 9, 2012
Future of health care?
Now that Obama's been reelected it looks like Obamacare (or ACA) will be here to stay. And who knows? This legislation (and his presidency) may well end up marking a watershed moment in US history, similar to FDR's New Deal (which gave us Social Security and the SEC) and Lyndon Johnson's Great Society (which gave us Medicaid, Medicare, and federal education funding). A lot of people are up in arms about the ACA, presumably because everyone is required to buy health insurance or pay a fine, BUT, it isn't a government takeover of healthcare. Doctors will still make boatloads of money (partly because of restricted supply) and Obama isn't going to be running any hospitals.
The figure below (taken from this good article) shows which countries actually do provide universal medical coverage (i.e., you typically don't have to worry about getting insured). Now, not only do you see Europe on there (pretty much all of it, apparently), but also Brazil, Australia, Japan, Argentina, Chile, Korea, New Zealand, and others (pretty much every other rich country but us). Interestingly enough, despite these countries' willingness to cover every citizen, almost all of them spend less per citizen on health care than does the US.

The figure below (taken from this good article) shows which countries actually do provide universal medical coverage (i.e., you typically don't have to worry about getting insured). Now, not only do you see Europe on there (pretty much all of it, apparently), but also Brazil, Australia, Japan, Argentina, Chile, Korea, New Zealand, and others (pretty much every other rich country but us). Interestingly enough, despite these countries' willingness to cover every citizen, almost all of them spend less per citizen on health care than does the US.

So what's our problem?
Monday, November 5, 2012
Can we cut taxes and supercharge growth?!
So it's a tenet of the Republican faith that lower taxes help economic growth. But is it true? A friend recently linked to this NYT piece about a recent non-partisan study which said there's no relationship between taxes and growth (and was withdrawn because of Republican pressure). Ostensibly, the Republicans had the report shelved because of methodology problems, but I'll leave that for you to judge.
This type of thing isn't that hard to determine on our own. I'll give you a simple graph with minimal commentary and let you decide. First, we're pulling data from the reputable (and awesome!) FRED archive here. The following shows economic growth since 1950 (in terms of annual percentage change in real GDP).

This type of thing isn't that hard to determine on our own. I'll give you a simple graph with minimal commentary and let you decide. First, we're pulling data from the reputable (and awesome!) FRED archive here. The following shows economic growth since 1950 (in terms of annual percentage change in real GDP).

It's pretty well understood that taxes were high in the 1950s through 1970s and significant tax-cutting started in the 80s under Reagan (with his second notable tax cut coming in 1986). Now, notice how often the economy reaches 5% growth before and after that year.
Subscribe to:
Posts (Atom)