
Monday, November 19, 2012
Saving or drowning?
I'm tiring of politics for the moment (I know--you too), so I'll endeavor to find other interesting things to talk about.... like saving money. Friends occasionally ask how much they should be saving for retirement, so I thought this might be of general interest. The chart below shows the percentage of one's income they should be saving depending on how long of retirement they're planning on (and how far away it is). To keep it simple, focus on the bottom half (which means you'll be living on 70% of your pre-retirement income). As highlighted, those of us ~30 years from retirement should be trying to sock away ~20% of our pre-tax income each year. Tough for sure, but it sure beats working when you're seventy. PS, notice what a difference waiting ten years makes.

The objective case for unions
There's been a lot of talk about unions lately because of the demise of Hostess, the Twinkie maker. Sure, the company probably went out of business because it couldn't pay the salaries demanded by the union. That's often the end of the analysis if one thinks of the Hostess union in isolation. BUT, if (like in the 1960s) a significant part of the labor force is part of a union, then the resultant effect is that median wages go up across the economy (compared to years with low unionization rates). Where does this money come from to pay for higher wages? Well, it basically means that the company's bottom line takes a hit and there's less money left over for the stockholders. Now, let me ask you, is your income primarily derived from holding stocks or from working? If it's the latter than you'd probably be better off with stronger unions.
Two academics (Western at Harvard and Rosenfeld at the University of Washington) released a paper last year in American Sociological Review which concluded that the decline of unions over the last ~40 years is responsible for up to one third of the concurrent growth in income inequality. See here and here (possibly gated). Here are some more details from Kevin Drum:
Postscript: one may worry about corporate profits (and company sustainability) amidst higher wages, but, despite the recession, over the last couple of years corporate profits have actually been at an all-time high.
Two academics (Western at Harvard and Rosenfeld at the University of Washington) released a paper last year in American Sociological Review which concluded that the decline of unions over the last ~40 years is responsible for up to one third of the concurrent growth in income inequality. See here and here (possibly gated). Here are some more details from Kevin Drum:
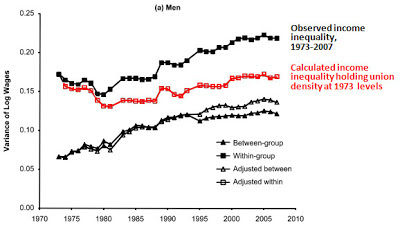
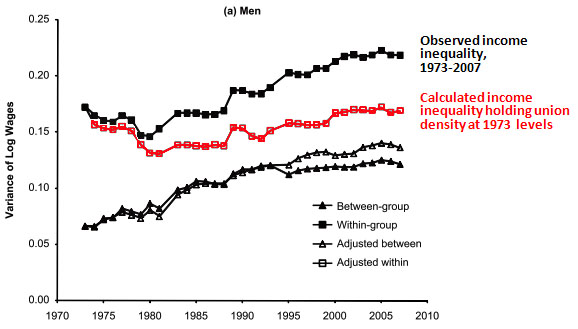
The authors use a model that accounts for both individual membership in unions as well as overall unionization rates in specific industries and regions. It also controls for education, age, race, ethnicity, and gender, which allows them to estimate the effect of unionization both between groups (e.g., the evolution of income inequality between high school dropouts and high school grads) and within groups (e.g., the evolution of income inequality within the entire subset of high school grads).
Once their model was in place, Western and Rosenfeld could manipulate their variables to estimate what income inequality would look like if union density had remained at its 1973 level. So what did they find? Answer: Among men, if you account only for the effect of individual membership in unions, it would be about a fifth lower, which agrees pretty well with previous estimates. But if you also account for the effect of unions on surrounding nonunion employers (who often raised wages to compete with union employers and to avert the threat of unionization in their own workplace), the effect is larger: Unionization at 1973 levels would decrease income inequality by a full third. You can see this in the chart below. For intragroup differences (which account for nearly the entire effect of unionization) the top line shows the actual rise of income inequality since 1973, while the red line is a prediction of what it would look like if union density were still at 1973 levels:
Of course, my title might be a bit misleading. One can only say there's an objective case to be made for unions if one wants to reduce income inequality. If you prefer more of a Gilded Age, well, then the unions' continued decline will do the trick.
Postscript: one may worry about corporate profits (and company sustainability) amidst higher wages, but, despite the recession, over the last couple of years corporate profits have actually been at an all-time high.
Friday, November 9, 2012
Future of health care?
Now that Obama's been reelected it looks like Obamacare (or ACA) will be here to stay. And who knows? This legislation (and his presidency) may well end up marking a watershed moment in US history, similar to FDR's New Deal (which gave us Social Security and the SEC) and Lyndon Johnson's Great Society (which gave us Medicaid, Medicare, and federal education funding). A lot of people are up in arms about the ACA, presumably because everyone is required to buy health insurance or pay a fine, BUT, it isn't a government takeover of healthcare. Doctors will still make boatloads of money (partly because of restricted supply) and Obama isn't going to be running any hospitals.
The figure below (taken from this good article) shows which countries actually do provide universal medical coverage (i.e., you typically don't have to worry about getting insured). Now, not only do you see Europe on there (pretty much all of it, apparently), but also Brazil, Australia, Japan, Argentina, Chile, Korea, New Zealand, and others (pretty much every other rich country but us). Interestingly enough, despite these countries' willingness to cover every citizen, almost all of them spend less per citizen on health care than does the US.

The figure below (taken from this good article) shows which countries actually do provide universal medical coverage (i.e., you typically don't have to worry about getting insured). Now, not only do you see Europe on there (pretty much all of it, apparently), but also Brazil, Australia, Japan, Argentina, Chile, Korea, New Zealand, and others (pretty much every other rich country but us). Interestingly enough, despite these countries' willingness to cover every citizen, almost all of them spend less per citizen on health care than does the US.

So what's our problem?
Monday, November 5, 2012
Can we cut taxes and supercharge growth?!
So it's a tenet of the Republican faith that lower taxes help economic growth. But is it true? A friend recently linked to this NYT piece about a recent non-partisan study which said there's no relationship between taxes and growth (and was withdrawn because of Republican pressure). Ostensibly, the Republicans had the report shelved because of methodology problems, but I'll leave that for you to judge.
This type of thing isn't that hard to determine on our own. I'll give you a simple graph with minimal commentary and let you decide. First, we're pulling data from the reputable (and awesome!) FRED archive here. The following shows economic growth since 1950 (in terms of annual percentage change in real GDP).

This type of thing isn't that hard to determine on our own. I'll give you a simple graph with minimal commentary and let you decide. First, we're pulling data from the reputable (and awesome!) FRED archive here. The following shows economic growth since 1950 (in terms of annual percentage change in real GDP).

It's pretty well understood that taxes were high in the 1950s through 1970s and significant tax-cutting started in the 80s under Reagan (with his second notable tax cut coming in 1986). Now, notice how often the economy reaches 5% growth before and after that year.
Friday, October 26, 2012
Why deficit, WHY?!
So, the country has been running a deficit the last few years. This is not news. Many in the media credit it to a vast run-up in government spending under Obama. Yes, spending has gone up on things like food stamps and other government relief programs that are used more in a recession. BUT, a large drop in government revenues also occurred and this comprises a large part of the deficit. The corresponding chart below shows taxes collected as a percentage of GDP.


Note how the most recent peak was around 2007, before a sharp drop when the recession hit, with the government's take going from ~18 down to 15% of GDP. Considering the size of our economy, that is a lot of revenue lost. Another relevant point I'll make is that politicians occasionally will make a platform out of promising to fix government spending at a certain percentage of GDP. With the huge baby-boom cohort now retiring, Social Security and Medicare will be soon be covering a large portion of the population. Thus, it's quite impractical (and a little insane, really) to think this can be done with the same amount of spending or revenue.
In a day or two I'll highlight how the markets are essentially yawning at this heightened amount of debt the government has issued, despite our politicians recent (and hypocritical) freakout about it.
Thursday, October 25, 2012
Lowest tax rates ever?
I'll continue with my schtick of providing historical context in the run-up to the election. If one gets enough of this context (both across countries and time), a number of the candidates' platforms seem quite silly. Tonight we show US top marginal income tax rates over time:


Now, if you go back even further you can find that income tax rates in the late 1920s were temporarily similar to those of today. So, essentially, we currently have tax rates at their lowest levels (save a few of the Bush 1 years) since before the Great Depression. In the 1920s, recall, we didn't have Medicare, Medicaid, Social Security, unemployment insurance, etc. So, if you hear someone complaining that our income tax rates are holding back small businesses or entrepreneurs, ask yourself: compared to when?
And, yes, you could argue and say that it's not just the top marginal rate that matters, but also the income at which the rate goes into effect. The fact that effect tax rates on the rich are at near all time lows, for example, is noted in this Poltifact piece: "for those in the top 0.01 percent of the income distribution, the effective tax rate was 71.4 percent in 1960, 74.6 percent in 1970, 59.3 percent in 1980, 35.4 percent in 1990, 40.8 percent in 2000 and 34.7 percent in 2004. If lower taxes did actually deliver economic growth, then our country should be booming! Also, is it any wonder we're having trouble paying for our social safety net with these kind of declining contributions?
Tuesday, October 23, 2012
No, our incomes don't just feel like they're stagnating
I thought more historical context might help make better voters out of us, so we'll soldier on in this same vein. The figure below shows the US median income over time according to the census bureau (I discussed this also here). The accompanying report can be found here. The gist? While income gains move temporarily up and down with recessions, it appears that median incomes are lower now than they were in 2000 (twelve years ago!). Couple this with the data on high-income earners I showed yesterday, and you find that the rich are doing very well, while the middle class have been treading water. And I think this is under-appreciated, but the median household income in this country is ~$50,000. Since many households rely on two incomes, I'm starting to picture an America where most people earn at or below $30k per year. Not quite what you'd expect from watching television or listening to politicians. Maybe we're not as rich as we thought we were.


Monday, October 22, 2012
Return to the Guilded Age?
Just finished the presidential debate and was surprised at how reasonable both candidates sounded tonight. Because of this similarity, I wanted to provide a little under-appreciated historical perspective. This figure shows the share of total income going to the top one percent.


Do you notice the effect of FDR's policies and/or see the middle class being borne in the late 40s? Do you remember who won the election in 1980? Sure, there is some noise in the figure, but the trend seems pretty clear. Why doesn't the middle class generally vote in its economic self interest?
Saturday, February 25, 2012
Defaults, automation, and deferred consumption
I've been talking a lot with my fiancee lately about tricks one can use on themselves to make the week more productive. For example, I usually throw away many of the vegetables I buy; typically I just don't get around to eating them. Something of a solution: now when I buy vegetables, I immediately chop them up according to how I use them (in this case, I make a few salads in tupperware), such that the food is ready to go when I need it during the week. Another example: my oatmeal was in a heavy, industrial size Quaker box on the top shelf (which itself contained large bags), such that there's a slight amount of effort required to make oatmeal each morning. This had meant that I'm eating other less healthy things for breakfast. Simple solution: buy some plastic containers with a lid to hold oatmeal and put em within easy reach. Every second counts when bussing it to work at 7am.
You also have to make these sorts of behaviors automatic. When I get up on Saturday, start the wash immediately. When I buy groceries, make lunches and slice vegetables for the week. When I get to work, don't check email or blogs, start a small project immediately. Making these decisions daily, even if they're small, requires some amount of effort. The more we automate the more productive and happier we are.
Ramit Sethi, from I Will Teach You to be Rich, has a great NY Times article on how to overcome these small behavioral hurdles that are keeping us from being rich, fit, and organized.
Somewhat relatedly, here's a small piece from bakadesuyo.com that tells us about the benefits of automating our sleep schedules:
The New York Times has an interesting article on the subject but the takeaway is here:
In what was the longest sleep-restriction study of its kind, Dinges and his lead author, Hans Van Dongen, assigned dozens of subjects to three different groups for their 2003 study: some slept four hours, others six hours and others, for the lucky control group, eight hours — for two weeks in the lab...
...Not surprisingly, those who had eight hours of sleep hardly had any attention lapses and no cognitive declines over the 14 days of the study. What was interesting was that those in the four- and six-hour groups had P.V.T. results that declined steadily with almost each passing day.
And:
All told, by the end of two weeks, the six-hour sleepers were as impaired as those who, in another Dinges study, had been sleep-deprived for 24 hours straight — the cognitive equivalent of being legally drunk.
The bolding is his. Notice how establishing these habits and practices now enable a sustained payoff (deferred consumption anyone?) in the future (whether it's being healthy or having a lunch packed). What can I do today to make my life easier in the next week, month, or year? That's what I'm trying to figure out.
Subscribe to:
Posts (Atom)