Wednesday, April 30, 2014

Those Republican lawmakers blocking Medicaid expansion may cause 17,000 unnecessary deaths

As you may or may not have heard, many states around the country are opting to not take the federal money associated with the ACA and expand Medicaid. If you're not familiar, Medicaid is publicly provided health insurance for poor people (in many states, only available to those that have kids). It also helps many seniors pay the bills for their nursing home. Anyway, many governors have decided not to expand Medicaid because of over-blown fears about costs, federal government solvency, and a general distaste for government. This is a problem, as it leaves a gap in public assistance for many low-income people, as they're too poor to receive ACA subsidies but not poor enough for Medicaid. This is how it breaks down by state:


You'll notice that much of the Republican south is opting out of the Medicaid expansion, as is a large conservative swath of states in the Midwest. For now there are 19 opt-out states. Here is a breakdown of each state's decision. Utah still hasn't ironed out what they're doing, but it appears it will be decided later this year in a special legislative session. Thus far, about 4.8 million people don't have health insurance because of the states that have opted out.

Now, what about the costs of expansion? First, It's 90% paid for by the federal government in perpetuity (and 100% paid for the first three years). Even though Republican legislatures have moaned about the unknown costs this will place on state governments, it turns out to be a spending increase of only of 1.6%


Okay, so a budget increase of 1.6% doesn't seem like a lot, but perhaps some state budgets are strapped. Perhaps some states can't afford any budget increases at all? Entirely possible. But, as always, there's a trade off here. It turns out that those states which don't expand Medicaid, in aggregate, will cause up to 17,000 unnecessary deaths across the US. This comes from a study by researchers at Harvard and the City University of New York. And here are some highlights of the real world consequences of these states not expanding Medicaid:
Some 712,037 additional people are likely to be diagnosed with depression. An additional 240,700 people will be faced with catastrophic medical bills.Some 422,553 diabetics will not get medications they need to treat their illness. Women will go without life-saving tests: among those aged 50 to 64, 195,492 will fail to get mammograms; and among those aged 21 to 64, 443,677 will not get pap smears.
You be the judge, of course, but it appears to me that states opting out of the Medicaid expansion aren't doing it to save 1.6% of their budgets. Perhaps they're wanting to spite the ACA? Who knows. But what we do know is that the decisions of these opt-out states may cause up to 17,000 unnecessary deaths.

Note: many state senators in Utah complain that the federal government is so strapped financially that it won't be able to deliver on its promises to pay for the Medicaid expansion. As of 4/30/2014, here are the rates the federal government pays to borrow money. With the feds paying 2.69% for ten years, does that make it seem like they're a bad credit risk? Does that seem like the rate you'd get from a credit card company, loan shark, or pay day lender? No, and that's because there's very little risk of the money not being paid back.


Tuesday, April 29, 2014

If we had the low traffic death rates of Britain, 20,000 people in US wouldn't die each year

While US roads can be scary places, they are safer than they used to be. Vox, the new Ezra Klein venture, provides this figure showing motor vehicle deaths over time:


In the US in a given year, you’re now about half as likely to die in a car crash in a given year as compared to the 1950s-1980s. That’s good! And it comes from such improvements as airbags, high seat-belt use, and reduced drunk driving. In terms of the difference in the number of yearly deaths, it’s down to 33,561 in 2012 vs 55,043 in 1969. Think about that for a second. Thirty-three thousand people die per year in America due to car crashes. Despite the improvements, that’s still insane. As Noah Smith noted recently, three times as many people die from car crashes each year than died in the terrorist activities of 9/11 and the two wars that followed (and think of the money that's been spent to prevent another terrorist attack).

But, what can be done about vehicle deaths? Are there countries to look to that are doing better? The Streetsblog reviews a fabulous report from the International Traffic Safety Data and Analysis Group and provides some comparisons. Here is the percentage decrease in road fatalities from 2000 to 2011 across several countries:


You’ll notice that the US decreased its number of yearly road fatalities by ~25% during that time period (one of the slowest improvement rates of any developed country), while most other rich countries decreased their yearly death toll by ~50%.  Where does that leave us today? In 2011 the US had a yearly death rate of 10.4 people per 100k whereas the rate for Great Britain was 3.1 people/100k (see Table 3 here). To put that more bluntly, if in this country people died in car crashes at the same rate as in Britain, ~20,000 lives would be saved each year!

Could you imagine what would happen if 20,000 US citizens were killed by terrorists? The country would freak out. So, if death is to be avoided no matter the cause, why aren't people pushing their politicians to do something about transportation safety? (Note that this high death rate makes auto-fatalities the number one cause of death for those from 5-34 in the US.) So what have other counties done to reduce their motor vehicle death rates?
In the UK, 20 mph zones have been steadily growing since the turn of the century, and automated traffic enforcement is saving lives. The Dutch abandoned a street design philosophy based on “forgiving” errant drivers (which America embraced), shifting to an emphasis on walkable, bikeable streets. Japan has perhaps the world’s best transit networks, making driving less necessary. Germany is a pioneer in traffic-calming street design. Sweden, as the Economist recently reported, cut pedestrian fatalities in half over the last five years with a strategy that included low speed limits in urban areas and building 12,600 safer street crossings.
Considering the great outcomes other countries are seeing, this is low-hanging fruit. Why isn't anyone talking about the 30,000 people that will die next year in the US due to this? To be honest, YOU may know some of those that will die. We all might, and yet this goes on year after year. WHY?

Monday, April 28, 2014

Peak car?

You may have heard of peak oil, the idea that the world will reach a point at which we can no longer increase our rate of oil extraction, but you may not have heard of peak car. If the data are correct, it appears that in the US the century-long love affair with cars may be coming to a close. Emily Badger at the Atlantic Cities describes what's happening:
The handy thing about "peak car" as a concept is that it can nominally be proven in many ways. You’ve got Peak Driver’s License. Peak Registered Vehicle. Peak Gas Consumption. Peak Miles Traveled. There are peaks per person, per household, per demographic. Then you've got your absolute peaks when you add up all of our vehicles and miles together, as if we were all cruising the highways at the same time.
[...]
Earlier this summer, Sivak released data showing that the number of registered light-duty vehicles in America (cars, pickup trucks, SUVs, vans) had peaked per person, per licensed driver and per household in the early to mid 2000s, before the onset of the recession. Because the U.S. population continues to grow, he predicted that the absolute number of vehicles had not yet peaked. But per person and household, we seem willing now to own fewer of the things.
She then goes on to show this chart from Michael Sivak:


Note that these peaks occur around 2004, demonstrating that this phenomenon isn't due to the recession. See more here. Also--and I'm not sure if my sample size is representative--the people I know in their 20-30s today don't seem to have the same interest in the conspicuous consumption aspect of car ownership that our parents' generation had.

Next we'll look at if transportation funding and home construction patterns (ie, size of garages) are following these trends.

Friday, April 25, 2014

Why did a Mesquite rancher start a range war with the Federal Government?

Not sure if you've been following the Cliven Bundy situation, but I've been a bit fascinated with it. For those who haven't been following, a rancher in Nevada (just south of Mesquite) has refused to pay grazing fees (of $1.67 per head per month) to the Feds for the right to use their land for his cattle operation. This has been going on for ~20 years, Bundy's accumulated over $1 million in fees, and the issue has wound through the various courts in NV. He absolves himself of wrongdoing by stating that his LDS forebears have grazed cattle in the area since the 1800s. But this dispute finally came to a head March 27th as the BLM (which is the local federal authority), attempted to follow through with a NV district court judge's order to impound Bundy's cattle.

Well, it wasn't that simple, as Bundy called for a "range war" and rallied various militias from around the country to his cause. Apparently, a large portion of the far right is angry about federal encroachment and were just dying for a specific cause to rally around. A large stand-off ensued wherein militia members had guns steadied on the federal agents (including snipers and other types you may not usually see near Mesquite in March) while the round-up progressed. Protesters were howling; I-15 was blocked; someone kicked a federal dog and was tazed. One protester said "We were actually strategizing to put all the women up at the front. If they are going to start shooting, it’s going to be women that are going to be televised all across the world getting shot by these rogue federal officers.”

Unsurprisingly, the BLM was worried for their employees' safety under these circumstances and called off the gathering of Bundy's cattle on April 12th. Afterwards, the Bundies claimed victory with one saying "We won the battle" and also saying that "the people have power when they unit. The war has just begun."

See here for a history of this mess and here for great topic cards from Vox (which include video of the stand-off). Oh and, here Bundy says that black people were better off as slaves. Hmmmm.

It's all very curious. Among the questions I have are these: 1) Bundy has been hailed as a patriot, but does that properly describe someone who's blatantly breaking federal laws? 2) How can conservatives complain about law-abiding people on welfare being moochers when Bundy owes taxpayers $1 million? 3) What kind of message does it send about law and order in this country when militias can intimidate law enforcement officials into not doing their job? 4) During the next immigration debate, how will conservatives be able to say "this is a country of laws" and thus advocate for a deportation-only immigration fix?

Finally, a Pat Bagley cartoon to make this worthy of a Friday:


Enjoy your weekend!

Thursday, April 24, 2014

If your family makes less than $50k per year, you'd be financially better off in Canada or Northern Europe

Yesterday we made the case that the US is a low tax, relatively high inequality country. This isn't hard to do, as it's widely accepted. In fact, one of the tenets of US economic policy since Reagan (who won his first term in 1980) has been that the economic growth brought by low taxes will lift all boats faster than if we had a more distributive economic system. But is this the case? An exciting new data set compiled by the LIS group at CUNY looks at income comparisons across countries for those all across the economic spectrum, and allows us to answer that exact question (via this article).

Here's a figure showing income growth, by income decile, from 1980-2010 across a handful of rich countries:


This comes from here (where it has an awesome interactive feature). The takeaway? For those making less than the median salary in the US, pay has risen much faster in almost every other developed country. And, across much of the income spectrum, several of these countries have now caught up with us in terms of pay. The authors of this article explain:
A Gallup survey conducted between 2006 and 2012 showed the United States and Canada with nearly identical per capita median income (and Scandinavia with higher income). And tax records collected by Thomas Piketty and other economists suggest that the United States no longer has the highest average income among the bottom 90 percent of earners.
And this:
More broadly, the poor in the United States have trailed their counterparts in at least a few other countries since the early 1980s. With slow income growth since then, the American poor now clearly trail the poor in several other rich countries. At the 20th percentile — where someone is making less than four-fifths of the population — income in both the Netherlands and Canada was 15 percent higher than income in the United States in 2010.
Consider this in the context of the tax and inequality charts we showed yesterday. Basically, if you're at or below the median income in the US, you'd be better off financially by moving to Canada, Sweden, Finland, the Netherlands, or Norway (or by voting for higher taxes here at home). Maybe I'm missing something, but considering this data, could someone explain to me why we'd want to continue the tax cut mania that Reagan started?

Note: this data comes via the Upshot, which is a very exciting new news/analysis venture at the NYTimes.

Tuesday, April 22, 2014

The US is a low tax, relatively unequal country, yes?

I got into an interesting discussion on Twitter today about whether conservative economic principles increase or decrease income inequality in the US. This surprised me, as I didn't think conservatives touted their policies as necessarily decreasing income disparities. Recall the whole rising tide lifts all boats mantra. The whole point of debate, I thought, was whether the Republican policies of high growth at all costs was worth the inequality that came with it. To back up my understanding here, I'll present a couple figures showing that the US is actually a relatively unequal country (in economic terms) and that we're a relatively conservative country (in terms of tax rates).

Here's a comparison of income disparities across developed countries in 2010 using this OECD report. Note that higher Gini coefficients mean greater income inequality.


So out of these thirty-four countries, the US is number thirty in terms of income equality (according to the Gini coefficient). More clearly, in the US those in the top 10th percentile on average make ~17 times more than the average of those in the bottom 10th percentile of income (right axis). Note that this ratio is only around 6 for many European (especially Nordic) countries.

Here are the corresponding tax rates for these OECD countries (as a percentage of GDP):


Note that, just as the US was one of the more unequal in terms of income, it is also has some of the lowest taxes of any rich country (not coincidentally). Note how we are grouped with Turkey, Chile, and Mexico in the low tax and high inequality regime, whereas the Nordic countries (and Europe in general) has opted for the higher tax and lower inequality model.

This isn't me passing judgment. It's just the state of things. The US has accepted higher inequality as the price it pays in its attempt to achieve more economic growth. The question of the decade, however, is if those higher growth rates are materializing and making everyone better off. We'll look at this tomorrow.

Monday, April 21, 2014

Utah's rate of sprawlification is increasing

This isn't huge news, but I did want to note it and file it away for future reference. A group called NumbersUSA just put out a report called Vanishing Open Spaces (thoughtful DesNews article here) which states that Utah is the number two state in the nation in terms of percentage increase in sprawl from 2002-2010.


Now, Utah isn't number two in terms of the total amount of area taken over by sprawl from 2002-2010, but by our percentage increase of sprawl. Do note, however, that we went from 7th (from 1982-2010) all the way up to 2nd (in the most recent period), so we are getting better (worse?) at using our land less efficiently.

In terms of the increased area taken over by sprawl over the 2002-2010 period (Table 11), Texas is number one and Utah's ranked 25 (up from 33 from 1982-2010!). For housekeeping's sake, I'll note that from 1982-2010 we added 646 square miles of sprawl in Utah, with 203 of those coming from 2002-2010. Despite the revitalization/urbanization efforts underway in SLC, by and large the last decade has seen an increasing rate of sprawl in Utah overall.

Note: I'm not sure why group based around immigrant policy, such as NumbersUSA, put out a report on sprawl, but the data and analysis seem to be aboveboard.

Does the mayor of Layton hate the free market or is he unfairly helping his home construction business?

Layton Mayor: Market schmarket.
Layton mayor, Bob Stevenson, recently put a moratorium on the construction of new apartments in Layton. He said "I do not believe Layton City needs any more apartments at this time," and that his city is "well within the range of what is needed for affordable housing." So, rather than have the market determine what gets built in Layton, Mr Stevenson prefers that that's decided by government. Need I remind this Republican that the market can decide what people want better than he can?

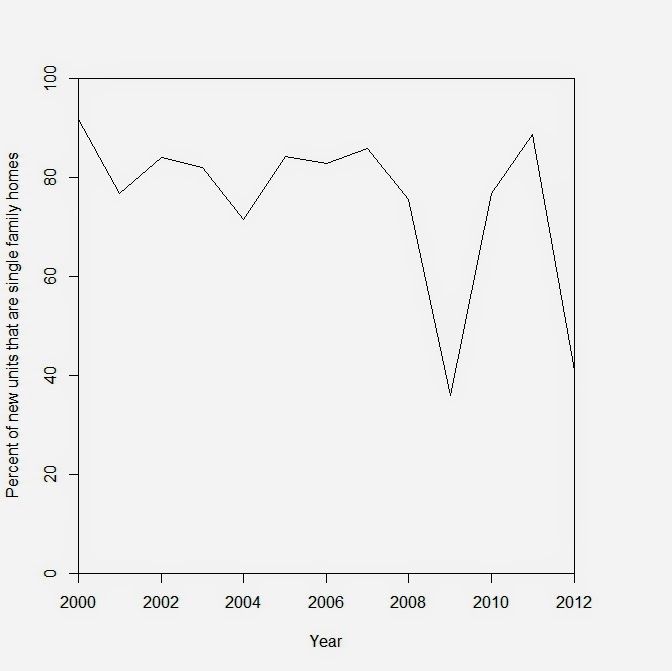
Despite Mr Stevensen's worries about apartments running amok in Layton, in actuality single family homes have been the focus of Layton construction over the last 13 years. Using data from the U's BEBR database we plot the percent of new construction that has been focused on regular, single family homes:


So, for about 8 or 9 of the last 12 years ~75% or more of the new units built in Layton have come in the form of single family homes. Considering this, and the fact that people are driving less and buying fewer cars than they used to, why would Mr Stevenson decree that the Layton residents need special government protection from new apartments? Can any locals confirm if the single family homes there actually need to be coddled by the heavy hand of government?

Note: Perhaps his decree is not entirely naive. His profile here states that he worked for BJS Quality Homes for 17 years. Guess what they specialized in? Residential home construction. Interestingly, BJS are the mayor's initials, so it stands to reason that he still has a ties to this company. Can anyone confirm? Maybe a  According to the this document, the mayor runs this company, so it appears his relationship to his business is affecting his policy decisions.


Layton citizens beware.

Friday, April 18, 2014

Drive to work but work to drive

Something lighthearted (but thought provoking, I hope) for the weekend. Found this cartoon from here and love it.


How am I doing this sort of thing in my life? Next week we'll examine some of the ways we do this. Have a great weekend!

Wednesday, April 16, 2014

Could a natural gas vehicle save you a pretty penny?

Checking the price of compressed natural gas (CNG) around SLC, it appears to currently be around half the cost of regular gasoline. While CNG stations were once fairly rare, Utah is fairly well covered these days. The closest station to downtown SLC, however, is at 900 S and West Temple. This coverage is notably worse than that for SLC's EV charging stations, but not a big deal since the CNG Civic has a range of 220 miles.


Whereas regular gasoline costs around $3.20 per gallon, the CNG America station on 900 S is at $1.66 per gallon equivalent. While one can convert their own car to run on natural gas (apparently for $12-18k, although Utah will give you a tax credit up to 50% of that), the Honda Civic dedicated CNG model has been in production since 1998 and "remains the only dedicated production sedan to run solely on compressed natural gas."

While the regular Honda Civic costs $18,390 the CNG version runs $24,140 (after Utah's $2,500 tax credit), which is a difference of $5,750. Since the gas mileage for both cars (considering the CNG's gasoline gallon equivalent) is roughly the same and the price of CNG is half as much as gasoline, driving 12,000 miles a year (at 38 mpg) would make the CNG cost effective after.... ~11 years. Hmm, not too bad, especially since CNG engines are known to last much longer than those of regular vehicles because of how efficiently they run. (I have known some enthusiastic CNG owners that buy their cars used, from public fleets and such, which appears another great way to do it.)

CNG vehicles also let you fill up in the comfort of your own home, help reduce our dependence on foreign oil, and have the following (substantial) environmental benefits:
Natural gas vehicles generally emit 13–21 percent fewer GHG emissions than comparable gasoline and diesel vehicles on a well-to-wheels basis.
Medium and heavy duty natural gas engines were the first engines to satisfy U.S. Environmental Protection Agency's (EPA) demanding 2010 emission standards for nitrogen oxides (NOx). 
The light-duty Honda Civic Natural Gas held the American Council for An Energy-Efficient Economy’s (ACEEE) title of “Greenest Vehicle” for eight consecutive years.  
Natural gas primarily consists of methane (around 90 percent), with small amounts of ethane, propane, and other gases. Methane is lighter than air and burns almost completely, creating carbon dioxide and water as byproducts.
I've just about convinced myself here. Interestingly, it appears that CNG vehicles can also run on biogas, such as that which comes from landfills and sewers. Hmmmm. Swamp gas has never looked so chic.

Any CNG vehicle owners out there that care to comment?

Air pollution now the world's greatest health risk

Many people dispute the notion that society should focus on reducing vehicle and factory emissions to combat climate change. You see it all the time, like from this guy:


While those employed in the coal industry don't have great job prospects, the benefits of moving away from dirty fuels are substantial and immediately felt. As to evidence of this, the World Health Organization (WHO) recently released a study which found that ~7 million people died in 2012 due the effects of outdoor and indoor air pollution. Accordingly, they find that "air pollution is now the world’s largest single environmental health risk." Here's more on the effects of this pollution:
In particular, the new data reveal a stronger link between both indoor and outdoor air pollution exposure and cardiovascular diseases, such as strokes and ischaemic heart disease, as well as between air pollution and cancer. This is in addition to air pollution’s role in the development of respiratory diseases, including acute respiratory infections and chronic obstructive pulmonary diseases.
They go on to note that "3.7 million deaths were attributable to [outdoor] air pollution" worldwide in 2012. While 88% of these deaths occurred in low- and middle-income countries, a staggering 94,000 deaths occur in North America were due to air pollution in 2012. Perhaps if the vague, hard-to-notice climate change doesn't make you wonder about our effect on our environment, then that statistic will.

So what do the deaths eventually come from? Here's the breakdown for 2012:


Acute lower respiratory disease and stroke appear to account for 80% of these deaths. With statistics like this, wouldn't you think that raising the gas tax would be something we'd be talking about as a society? Or maybe putting a price on the pollutants factories emit? While I understand that some people aren't going to grasp the implications of climate change, taking no action to stop 94,000 North American deaths a year is insane.

Note: thanks to this blog for the pointer.

Monday, April 14, 2014

We probably should be saving a bit more money

Considering the long-term unemployment issues affecting older workers here (noted here), I imagine many are suddenly finding them far short of what it takes to live off of their savings. And that's unfortunate for sure. As a refresher for those of us still in the accumulation stage, I'll plot the results of various savings rates over different time periods. Note that this assumes one starts with $0 and sees 5% annual growth, which is a plausible inflation-adjusted rate that you may get in your 401k or IRA.


Note that 1) saving even modest amounts per month can lead to substantial sums and 2) starting early makes a world of difference.

Recall that if you want to pull $30,000 per year from your retirement accounts (to supplement the average $15,000/yr social security benefit), you'll need roughly $750,000 overall (because of the rule of 25).

If you want to accomplish this, check out this impressive wiki from the Bogleheads for solid advice that lets you organize your investments and move on with your life.

Long term unemployment still a very large problem

While the Utah economy has been doing well lately (see here), things aren't anywhere near back to normal. Even though I mentioned the median duration of unemployment here, I didn't know it was so much worse for those 55+.

Here's a time series of the median duration of unemployment split up by gender and age (from here):


So, the median duration of unemployment for workers under 55 years old is ~17 weeks. That's four months! For workers above 55 years old, the median employment duration is about 27 weeks. That's ~6 months! While I don't have much more to add, I post this to note that if there is currently a real crises in the US, its the plight of the long-term unemployed. There are good comments on this here and the original paper is here.

Sunday, April 13, 2014

Is an electric car doable in SLC? Just might be.

Electric vehicle (EV) infrastructure was in the news recently here in Salt Lake City, as the SL County government center (at 2100 S State St) recently received a brand new, high-speed charging station. These new connections will recharge a vehicle in 10-40 minutes, will be open around the clock, and allows users to buy electricity via credit card. Pretty sweet. These installations aren't the first in SLC, but they are notably faster than those that already existed. Here's a map of stations in SLC (via the interesting plugshare.com):


So, decent coverage right? (Especially if you join the club to share your home plug, which apparently some do.) Sadly, not all charging stations are built for speed, though. For example, near downtown SLC we have:

Level 1, which is 120 Volts (same as a regular wall outlet). These can add about 4km of driving per hour of charging, so for the Nissan Leaf, which has a range of 84 miles, it'd take ~21 hours to fully charge. Sounds bad, but since 78% of commuters travel less than 40 miles each day that'd be ~10 hours of charging per night. Basically, using one of these 120 V outlets at your house would work, but don't get stuck and rely on these around SLC. They're found at most of the green icons on the map (above). Besides the public chargers, interestingly, the Hilton, Smiths (8th S and 9th E), and Whole Foods (Trolley Square) provide chargers as well. And all of these appear to be free.

Here's a Level 1 public station at 50 E and 300 S:


And here's one at Whole Foods (Trolley Square):


Level 2 charging stations use 240 V (like a washer/dryer) and add at least 12 miles of charge per hour. So a Leaf can fill in about 7 hours with the Leaf S standard 3.3 kW charger and ~3.5 hrs for vehicles with the optional 6.6 kW chargers). These 240 V outlets can be installed in your garage for about $1k-2k and can be found in SLC at the Main Library, at Ken Garff Nissan (777 S W Temple), and at the Utah Division of Air Quality (195 N 1950 W). So, basically two in the SLC CBD. This site provides a handy list (by zip code) of where the Level 2's are in SLC.

DC Fast Chargers can charge a vehicle in as little as 10-40 minutes (providing ~40 miles of range for 10 min of charging) and require more power than your house. The only ones I'm aware of in SLC are those that were recently installed at the SL County government center.

And for those of you who need to charge up your EV while hitting up a strip club, Salt Lake has got you covered:


Who says this town is only built for conservatives?! But in all seriousness, if my wife and I lived in a house we might just be looking at buying an EV. While I've tried to convince her that we could string an extension cord out our apartment window and onto the street, she says that probably wouldn't be wise.

Thursday, April 10, 2014

No, the government's debt isn't out of control (and, yes, we should worry about unemployment)

For the last several years (since the fear of an economic meltdown passed, really) it's been almost a truism in America that government debt is out of control. This has been what serious people say and repeat and focus on, despite the fact that the economy has never fully recovered since the crisis. Despite the continued economic malaise, people on the left and right have called for the government to cut spending, and many cuts were indeed made (hence the sequester, debt ceiling stand-offs, etc). Even back in 2009 President Obama made the dumb mistake of saying that, as families were tightening their belts, so too should the federal government. With the economy still far from healthy, you still hear people saying that government outlays are still too great. This, from Utah Rep Ken Ivory, is a great example:


The rest of our conversation is here. For the record, currently the US spends 6% of its budget on interest payments and 19% on the military (see here). Rather than reply and argue this each time it comes up, I thought I'd present three charts here that help us gain a general sense of economic history. The data and figures come from the wonderful FRED database, which can be used by all.

First, I'll present a time series of total federal debt (the red line, right axis) and interest payments on this debt (the blue line, left axis) as a percentage of GDP:


Couple large features. Notice the large increase in debt (red line) during the second world war, and then the notable decrease through the 1950s-1970s. Indeed, the federal debt increased quite rapidly during the crisis of 2008-2010 because of TARP, ARRA, unemployment benefits, food stamps, Medicaid, and other social safety net mechanisms that kicked in during the downturn. For sure, gross federal debt of 60% is high in historical terms, but it was half again as high during WWII and this didn't result in economic catastrophe. Also notice the concavity (ie, the change of the change) of the red line over the last year. This means the deficit has most recently been shrinking, not growing. Another barometer for how dangerous the situation is is how much interest is being paid on the debt. This is true not only because more debt means more debt is being charged interest, but also because the interest rate goes up on the debt as one becomes more of a credit risk. BUT, note how the amount of interest paid by the US (relative to the size of the economy) was twice as high throughout the 1980s and 1990s (blue line) as it is now. If investors were worried about the US defaulting on its debt, they wouldn't be lending it money for a paltry ~2.65% (for 10 years).

Another general claim made by many is that inflation is out of control and that 1) the government is trying to inflate away its debt, 2) that it is thus can't be trusted with any more debt, and 3) that we should thus again tie the dollar to gold. I'll let FRED speak to this. Here's a time series of the inflation rate (sans the volatile food and energy):


Note that inflation is currently at almost a fifty year low, and there are even good arguments that more inflation is needed at present.

Finally, to demonstrate that worries about debt and inflation are not only overblown, but also distracting us from a larger crisis, here is a time series of the median duration of unemployment in the US (ie, half of the unemployed at any given time have unemployed longer than the median duration and half for a shorter time).


So, the median unemployed person has currently been out of work for ~15 weeks, whereas the highest rate previously was around 10 weeks (gray bars are recessions). The gist is that the country hasn't seen an unemployment crisis anything close to our current situation for 50+ years (and likely since the 1930s).

Considering these three charts, why would anyone be worried about the debt or inflation instead of the unemployment crisis?

Note: I chose this measure of unemployment because the simple unemployment rate masks how many people are moving into and out of the labor market at any given time. I would have used the U-6 rate, but the FRED database didn't have it in a long time series.

Bike share program looks to make SLC fitter, happier, and more productive

SLC’s bike share program, GREENbike, opened up for the summer season this week to much fanfare. And, I’m excited about it! It’s $5/day and $15/week to get access to bikes placed all around town (see map below), which is a great deal. For a year, it costs $70, which includes a free helmet. The locations appear to be fairly densely placed throughout the CBD, while also providing some breadth across town. The program is set up for 30 minute trips, so it’s built for trips across town and not so much for joy riding visitors. It’s a bit of a utilitarian commuter setup, which isn't bad. Considering the need for non-car transport options in SLC, it’s downright spot on, actually. Tourists wanting to check out the city could simply use different bikes as they visit various sites around town.

The map (green means bikes are available at that location):


And the Key Bank / Temple Square Station:


More info can be found here and their Facebook page and Twitter feed are here and here. Check em out!

Note: Radiohead's OK Computer can be listened to in its entirety here.

Wednesday, April 9, 2014

Utah may have the healthiest (non-oil boom) economy in the nation

While I've mentioned Utah's low unemployment on the blog before, I recently found that Utah recently has had some of the highest wage growth of any state in the US as well. This is highlighted in this chart (from here):


Since North Dakota is experiencing an old fashion oil boom, it appears that Utah, at 3.6% wage growth last year, is effectively doing the best at raising incomes for any state with a normal economy. This is somewhat expected in a tight labor market (employees have more bargaining power), but great to confirm nonetheless. Recall that unemployment across Utah's major metropolitan areas is some of the lowest in the US:


Note that Logan (3.3), SLC (4.0), Provo (4.0), and Ogden (4.4%) have lower unemployment than almost any other metropolitan area as of January 2014. For all the flak I give local policy-makers, they do deserve some credit this. Great job!

Tuesday, April 8, 2014

Salt Lake City: where parking lots are the size of city blocks

SLC: where parking lots get corporate sponsorship
I thought it might be somewhat enlightening to discuss the city center today. First, the heart of downtown SLC could be considered as being from North Temple to 100 S and from 200 W to State Street. While the blocks between State Street and West Temple have been scrubbed and are now built up (via City Creek; see below), west of there things quickly take a turn for the worse. In particular, the blocks between West Temple and 300 West (and between South and North Temple) appear to be something out of the 1980s (ie, blight, no pedestrians, no shops, no housing--just pavement). Considering the number of people that could be housed in this area in a few tall apartment buildings, it's odd that the city would focus so much on the benefits of City Creek, while neglecting the poorly-used area immediately to the west.

Here's the general lay of the land:


Note that almost a quarter of the central business district (CBD) is taken up by parking lots. If you're the kind that likes to keep things simple (as I tend to be), the center of SLC can be said to consist of four components: Temple Square, City Creek, the Salt Palace, and the parking blocks (in almost equal proportions). To show how this looks in person, below is the block between West Temple and 200 W, and then the block between 200 and 300 W.


Ah, the beauty of downtown Salt Lake City. It's very weird. If the city wants to rejuvenate downtown, leaving entire blocks bereft of anything at night (and full of idle cars during the day) might not help their cause. This is some of the most prime real estate in Utah, and indeed, in the Intermountain West. So why isn't it being put to more efficient use?

Monday, April 7, 2014

Delicious $10 dinners for two in SLC

Shawarma: the best thing you've never tried?
For the dear wife and I, the cultural experience since getting married has been characterized by two main (and seemingly contradictory) centers of gravity. We both love eating out and we both love saving money. This of course, colors the food recommendations made on this blog. For example, California Burgers may not have the best tasting burgers in the Salt Lake Valley at any price, but they’re instead on what we can call a efficient value curve. For what they cost, you likely won’t find tastier burgers in SLC than those from California Burgers; relatedly, at their level of tastiness, you won’t find such burgers any cheaper in SLC. This has inspired some thinking to find other great value propositions around Salt Lake City. The requirements for this list: 1) delicious food and 2) dinner for two for ~$10.

1) La-Cai – Chicken curry – Large amount of delicious curry for under $10.

2) Chunga’s – Al pastor burrito – Al pastor is pork marinated in dried chiles, pineapple, spices which provides an unbeatable flavor (spicy, savory, fruity). Not sure if it's necessary, but the burritos here are also available in chicken, steak, and veggie varieties. Comes with chips for $8.63. Can’t believe this place doesn't get more attention.

3) Chipotle – Burrito – The king of food service innovation provides a different burrito experience than Chunga’s; Chipotle is all about neatly presenting fresh ingredients in a non-smothered burrito. The options here are carnitas, barbacoa, steak, or chicken. Comes with chips and guacamole for almost $10 exactly.

4) California Burgers – Two delicious hamburgers (try the bulgolgi or chipotle burger), fries, and drink (using one combo meal) for $12.14. These guys, who deserve more praise, were profiled here.

5) Oh Mai – Two fresh, tasty, bahn mi sandwiches – I recommend the garlic-butter rib eye steak (just say S8). The flavors are unique and the price is right. $11.82 for two.

6) Curry Fried Chicken – Two shawarma wraps and spicy fries – Delicious shavings of meat from the spit with fresh veggies and an amazing sauce in a pita. I like these sooo much better than the typical gyros with yogurt sauce. Just ask for shawarma and hot fries--they'll split the shawarma into two regular pitas for you. All for $9.15. We profiled them here.

We've gotten so engrossed in this kind of eating that Chipotle burritos (for ~$10) are something of a unit of measure at our house when contemplating large purchases. So much good food in Salt Lake right now. What are your favorite spots?

Friday, April 4, 2014

The Urban Lounge: an SLC treasure

I was at the Urban Lounge last night for
Stephen Malkmus and the Jicks, and don't think I've ever fully appreciated this venue before. At 241 S 500 E, Urban consistently brings in great national and local talent for a very reasonable price. Even being a well known act, the Jicks (great show by the way) were only $25.

The place is intimate and the crowds are generally laid back. One can easily saunter within 10 feet of the stage throughout the show. Their calendar is here and some surprisingly thoughtful Yelp reviews are here. Looks like the place is still run by Will Sartain (and the company he and Lance Saunders own, S&S Presents), whom you'll meet if you spend enough time at SLC shows.

One bonus feature: fine art. The drummer mentioned that they were trying extra hard to stay on their game because of this:


And Stephen Malkmus (still worthwhile, silly, and full of non sequiturs): 


Other notable acts that've come through in the last few years include Built to Spill (who perhaps have moved down from the Depot for good), the Silver Jews, Jeremy Enigk (of Sunny Day Real Estate fame), Nada Surf, Mates of State, and Neon Indian. The Jicks have been making the trek out every other year lately. It makes one swear off USANAESA, and the Maverick Center for good.

Note: one of our favorites, Kishi Bashi, will be at Urban on May 23rd. His NPR Tiny Desk Concert is here. In the last two years he's played at the State Room and Kilby Court.

Thursday, April 3, 2014

Fancy a barren SLC? You wouldn't be the first

Avenues residents: "I'd prefer a vacant field, thank you very much."
A little dispatch from the Avenues today. For those unfamiliar, the Avenues neighborhood of SLC is
filled with old, restored homes that were built in the early to mid-1900s.
It’s a historic district with tree-lined streets, and while there are some homes built in recent decades, these have generally been carefully integrated into the area's general look and feel (with the help of the historic board). While there are some young renters here, the general setup is a gaggle of successful older people looking to preserve the area (from construction and development, etc) at the expense of pushing people with more moderate incomes to West Jordan and points south. Avenues residents don't necessarily want to push lower-earning people elsewhere (that's just a byproduct), they're just trying preserve their tranquil neighborhood.

Each month this well-to-do neighborhood of SLC puts out a newsletter and it’s filled with all sorts of tasty morsels. The March edition described how the Greater Avenues Community Council has been wanting a community garden for years, but weren't able to find a proper location. Why was it so hard? Well, here's one reason:
In 2007, the committee worked with Salt Lake City to obtain permission to use the vacant field at the top of Lindsey Gardens Park, behind the fire station on 11th Avenue, at the corner of 10th Avenue and M Street. The City agreed to allow the field to be used as a community garden. The committee contacted all the adjoining homeowners to the site. Some homeowners objected to the increased traffic that a community garden would bring to this area and the City then withdrew permission for this site.
So, certain residents were anxious about the radical change a garden would bring to their neighborhood. A garden! That's how far certain residents have gone in terms of their wanting to preserve the status quo. And the worst part is that Salt Lake City actually listened to these people. When one prefers a vacant field to a productive garden (in SLC proper, mind you), you know something has gone wrong with the community. Need I remind readers that when developments like this are pushed elsewhere, we all get a little fatter, poorer, and less productive? Probably not, but the guy who prefers the field should probably hear this. And if this man prefers to live by fields, that's his call, but one simply can't expect that well within an established neighborhood of a capital city.

Note how much driverless vehicles (by Google, say) will help with this dynamic, as eliminating the need for parking around new developments may go a long way to appease NIMBYs. What also might help this dynamic is simply building what you want on your own land. Who says all the neighbors have to consent?

Wednesday, April 2, 2014

California Burgers is the best burger joint in SLC (sorry Lucky 13)

Slightly northwest of downtown SLC, there’s a quiet neighborhood where you’ll find West High, Washington Elementary and a soon-to-be-built branch of the SLC Library System. This area, called the Marmalade District, is also home to a restaurant that is challenging Lucky 13 for the title of best burger joint in Salt Lake City. What’s the humble place that you’ve probably never heard of? California Burgers. It’s at 306 N 300 W, directly across from West High and on the southern border of Marmalade.

Run by an efficient Asian family (is that redundant?), the restaurant sits in a former location of Molcasalsa (this is still what you’ll find in Google’s street view, although the new restaurant’s a few years old). Now to the food: the burgers are incredibly tasty, while not being huge like those of the Garage or Lucky 13. The fries come piping hot, medium cut, crispy on the outside and soft inside. They're generous with the fries and seem to always throw in a couple onion rings. There's also great diversity in terms of burger selection without reaching outside their expertise. They’re famous for their bulgogi burger (my wife’s favorite), but have numerous other very solid selections such as an amazing chipotle burger, jalapeno burger (which we haven’t tried yet) and straight up bacon burger.

For those who aren’t so into burgers, they also have French dips, turkey and fish sandwiches and even chicken fingers (I haven’t tried these items, but the people on Yelp seem to vouch for them). The specials are great values; my wife and I have starting getting a combo and extra burger (for ~$11) since the fries are so plentiful. In addition to the flavor being better than that at Lucky 13, California Burger is also a better value proposition as well, which makes it our current favorite burger joint in SLC.

Ignore the decor (they’re in a rough spot with all of the West High kids nearby). Go for the food.

Yelp reviews are here and Google reviews are here.